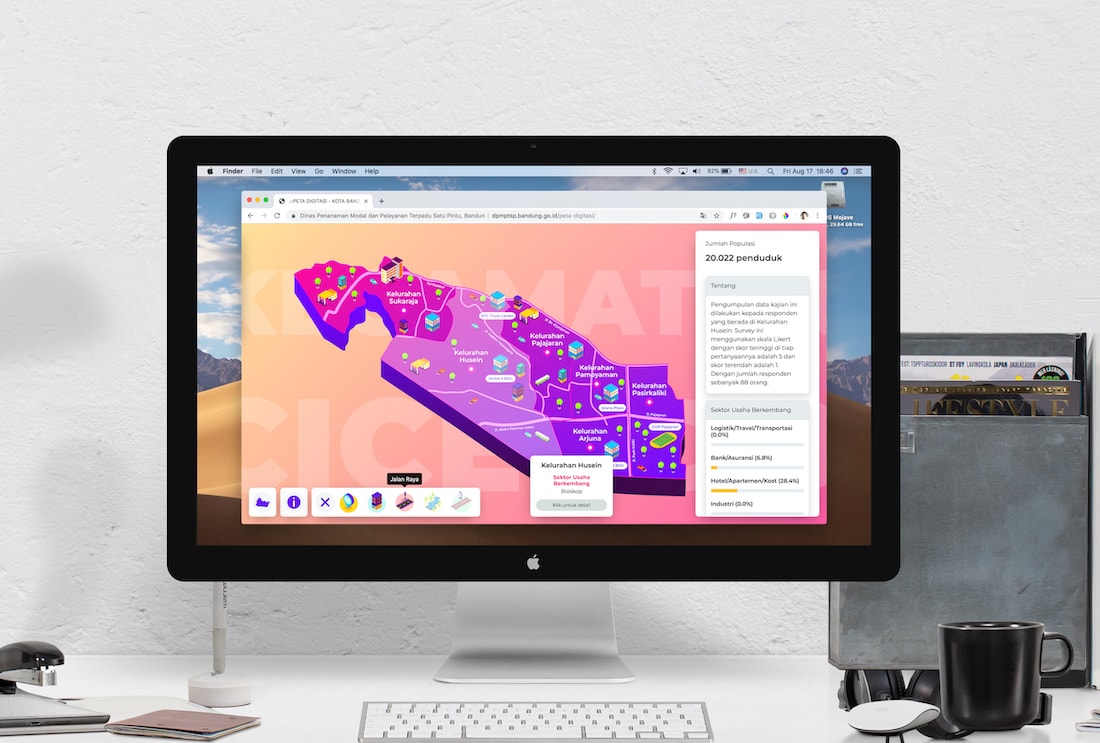
This project is a digitizing map project to show the spread of investment potential and business opportunities in the city of Bandung, Indonesia.
DPMPTSP Kota Bandung
Graphic Design
September 11, 2018 – October 31, 2018
–
The output we provide is:
The results of research in the form of a 30 cm thick book, we try to learn and mapping which information must be conveyed, which can be replaced with graphical visualization. The result is that most of us can visualize it into graphics and with attractive colors making it very easy to understand.
The difficulty is that the results of visualization must be described based on the results of the study. We must be able to describe how the results of the research can be visualized easily and well by the readers.
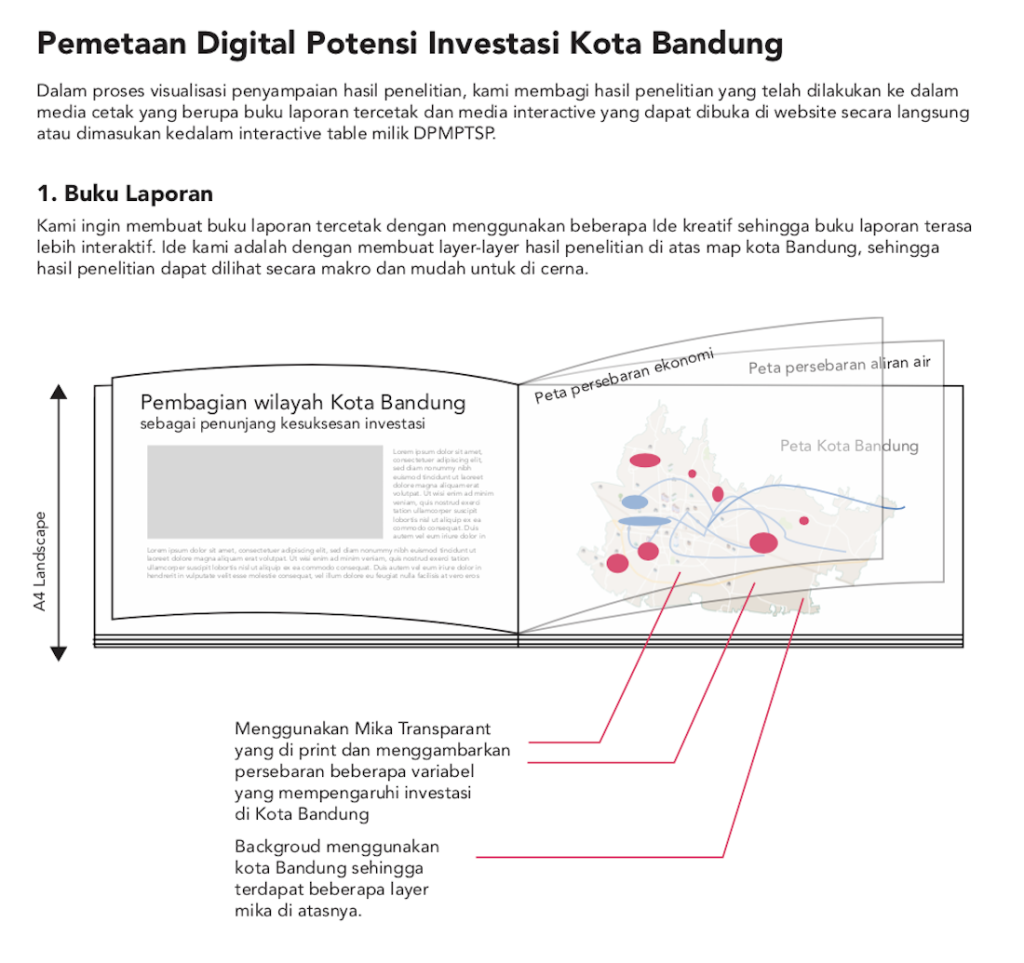
The results of our research try to study comprehensively and in detail. Then try mapping one by one, so we can get an idea of how the results of the research can be visualized.
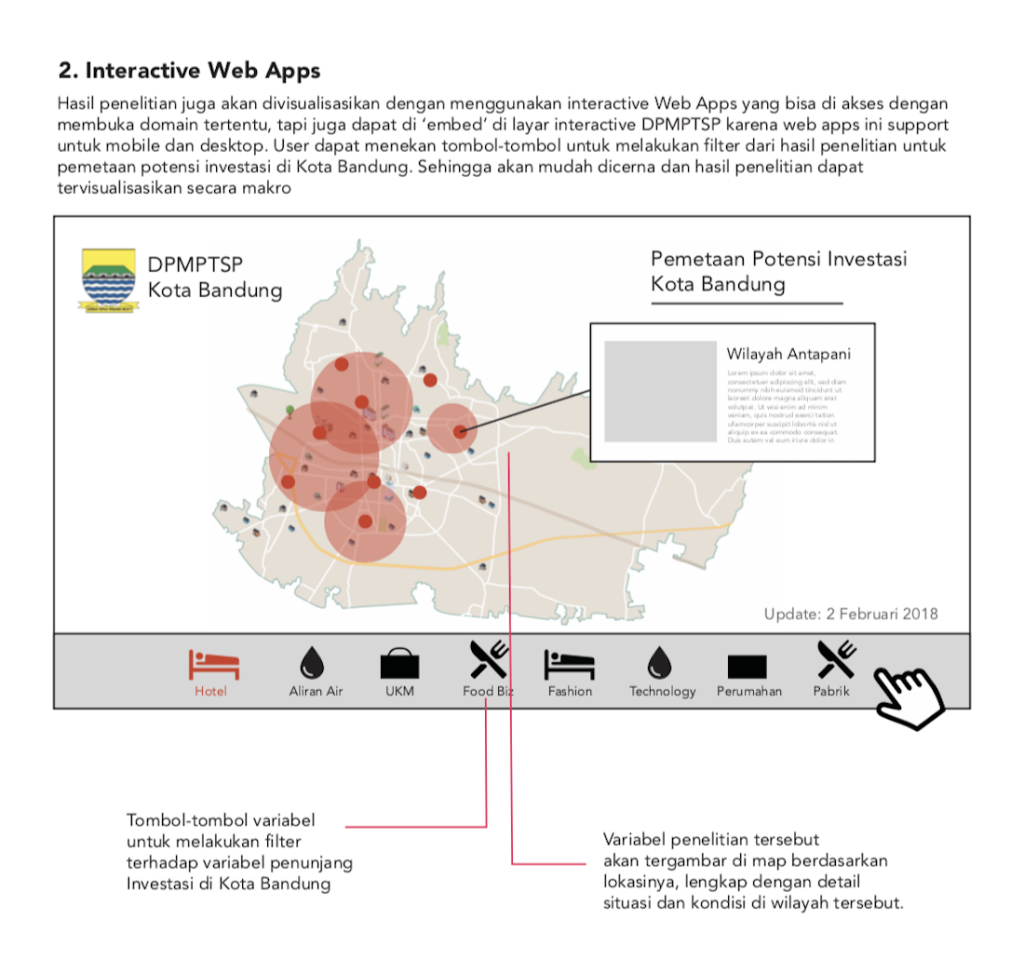
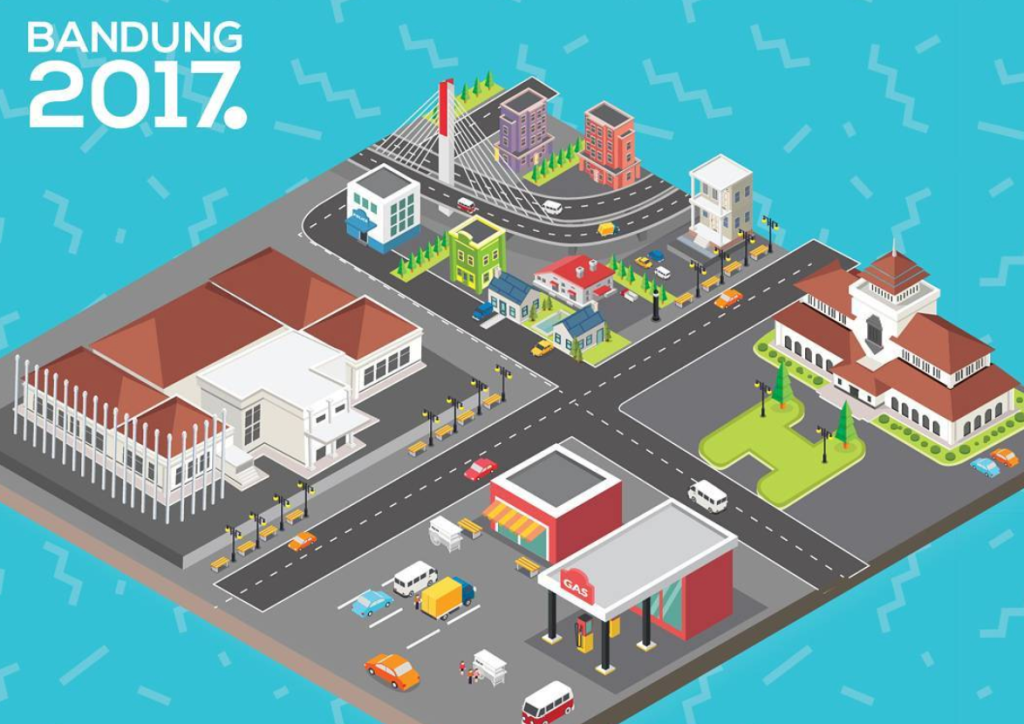
We then made a number of graphic options that could be implemented, one of the options we offered at that time was isometric style graphics with gradations of color. We have tried a combination of several color gradations.
Next we created the Bandung city map by using svg output, which in its interactive implementation uses javascript and html 5 so that it can interact interestingly.
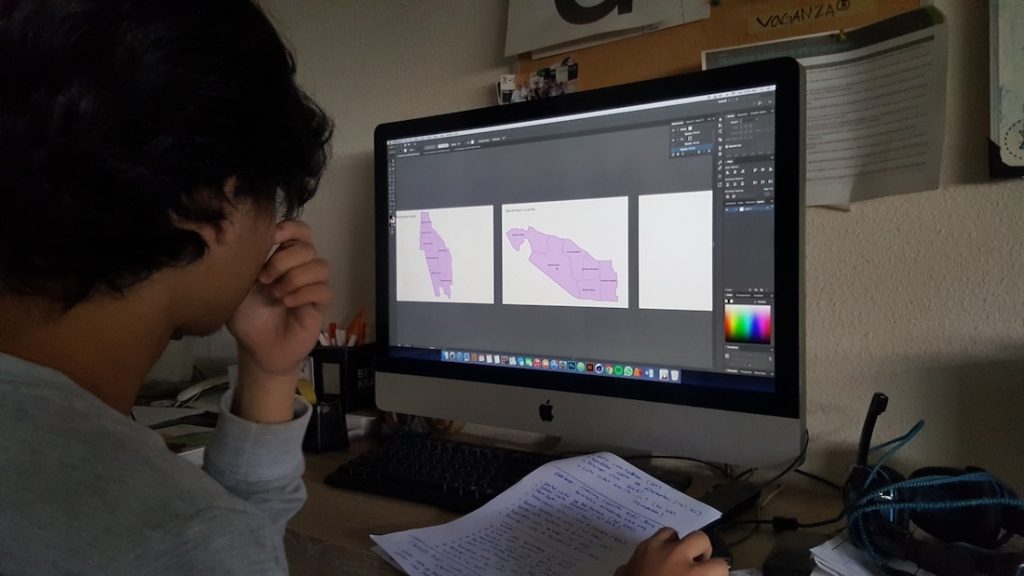
While we made the interaction website, we also made a graphic design for the book so that it can be in line with his digital map website.